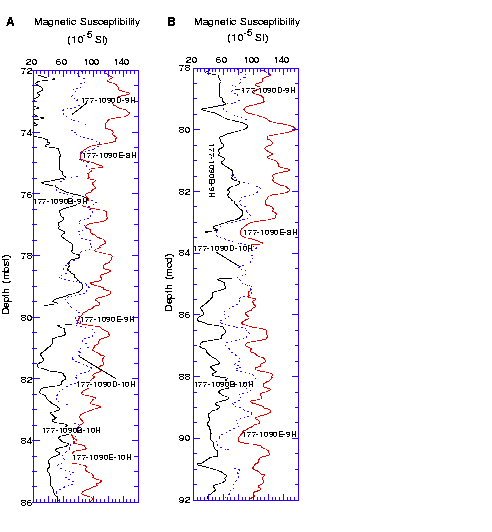
Figure
F1. Portions of the magnetic susceptibility records from
Site 1090. A. Cores 177-1090B-9H and 10H (left
curve), 177-1090D-9H and 10H (middle curve), and 177-1090E-8H,
9H, and 10H (right curve) on the mbsf depth scale. Data from each
hole are smoothed with a 5-point running mean and horizontally
offset by a constant for clarity. B. The same
cores on the mcd scale. The composite depth section has the
advantage that features common to all holes are aligned.