![]() Figures F1-F32
Figures F1-F32
![]() Tables
T1-T3
Tables
T1-T3
F1. Site 808 summary diagram.

F2. Locations of Leg 196 drill sites.

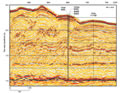
F3. Seismic profile crossing Site 808.
F4. Locations of Leg 196 and 131 drill holes at Site 808.

F5. Quality-control logs.

F6. Visual interpretation of log units.

F7. Definition of log units based on statistical analysis.

F8. Statistical data for each log unit.

F9. Summary of Site 808 log and lithologic data.

F10. Crossplots of log properties.

F11. Leg 196 fracture dip and strike and Leg 131 core fracture frequency.

F12. RAB image of all interpreted fractures.

F13. RAB image of the frontal thrust zone.

F14. Stereographic plot and Rose diagram of poles to fracture planes.

F15. Bedding dip and strike.

F16. 3-D RAB image of frontal thrust zone.

F17. Physical properties of the décollement zone.

F18. RAB image of the basal décollement zone.

F19. RAB images of borehole breakouts, 280-325 mbsf.

F20. RAB images of borehole breakouts, 460-505 mbsf.

F21. Comparison of LWD and core densities.

F22. Least-squares fits of core grain densities.

F23. Comparison of LWD-derived and core porosities.
F24. Comparison of densities at Sites 808 and 1173.

F25. Comparison of porosities at Sites 808 and 1173.

F26. RAB resistivity logs.

F27. Comparison of ring, bit, and button resistivities.5

F28. Resistivity correlation diagrams.

F29. Comparison of ISONIC, core, wireline, and VSP P-wave velocities.

F30. Summary of synthetic seismogram analyses.

F31. Video of ACORK fall.

F32. Video of ACORK components lying on seafloor.

T1. Site 808 operations.
T2. Log unit properties.
T3. ACORK components and their depths.