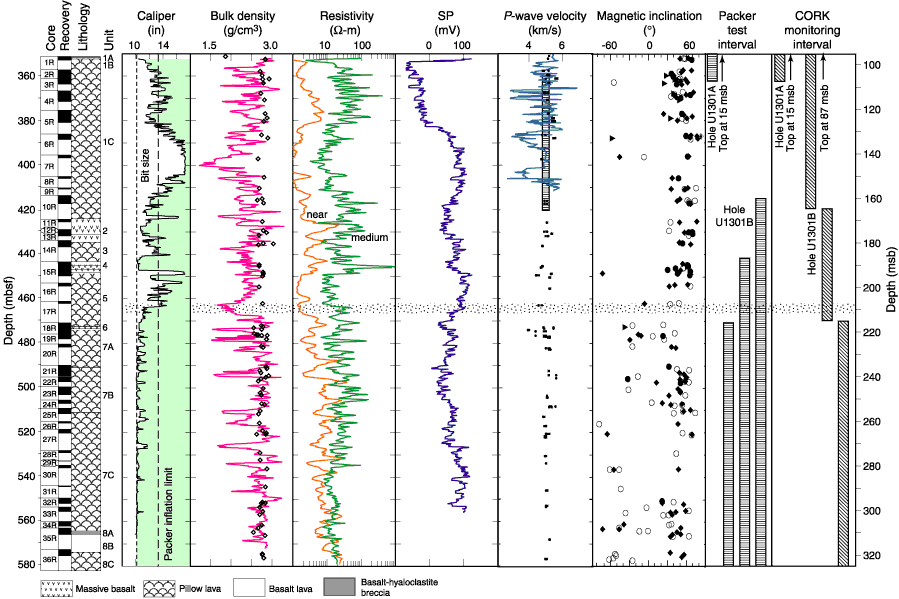
Figure F10. Summary of selected data from basement in Hole U1301B. Columns on the left show depth below seafloor, cored intervals, and recovery. Primary lithologies and lithologic units were defined on the basis of igneous petrology. The next five columns show wireline logging results. The caliper log is from the lithodensity tool, and the diameter of the drill bit and the maximum recommended packer inflation diameter (for both drill string and CORK packers) is shown for reference. Wireline bulk density data are compared to measurements of small hand samples. Resistivity data are from the near-borehole (~10 cm) and medium-penetration (~30 cm) electrode spacings. The spontaneous potential (SP) log is sometimes used as a hydrogeologic flow indicator, but data were collected in Hole U1301B very close to drilling and casing operations, before the hole had a chance for thermal equilibration, so SP variations may be more influenced by hole diameter than by fluid flow into or out of the formation. The sonic logging tool did not penetrate a borehole obstruction at 420 mbsf, but data collected in the upper part of the hole are in general agreement with both physical property measurements and an interval velocity determined from a vertical seismic profile (thin rectangle). Magnetic inclinations were determined on individual samples. Note change from dominantly positive magnetic inclinations in the upper 100 m of the hole, to mixed positive and negative inclinations in the lower part of the hole. Intervals tested with a drill string packer, and monitored by CORK observatories in Holes U1301A and U1301B, are shown in the last two panels. The primary depth scale (mbsf) is referenced to Hole U1301B, but packer and CORK depths for Hole U1301A are registered to the depth into basement (msb). Finally, the dotted band near 465 mbsf (210 msb) shows an apparent boundary between crustal intervals having distinct properties.