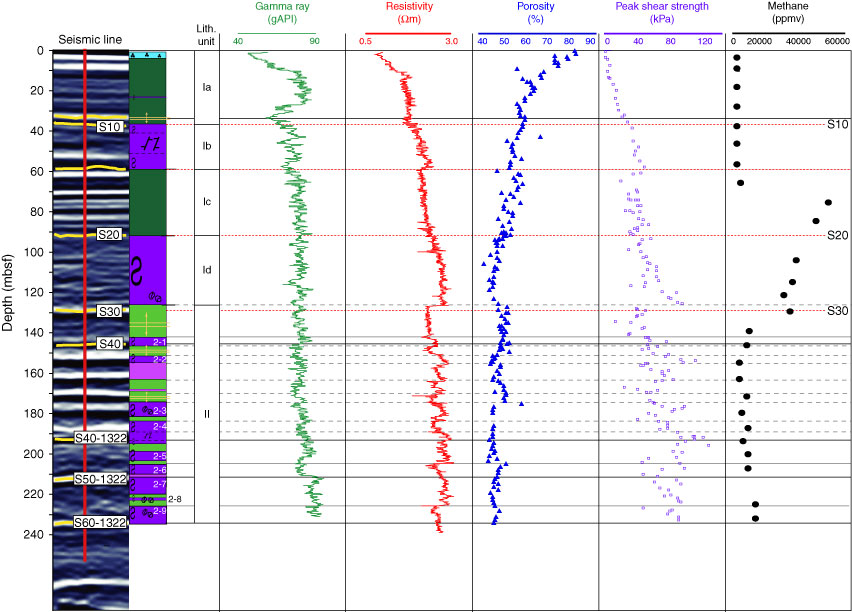
Figure F16. Combination diagram showing seismic strip chart, the lithologic column with lithostratigraphic units deduced from core description, downhole variations of gamma ray intensity and resistivity, porosity, experimentally determined peak shear strength, and headspace methane contents at Site U1322.