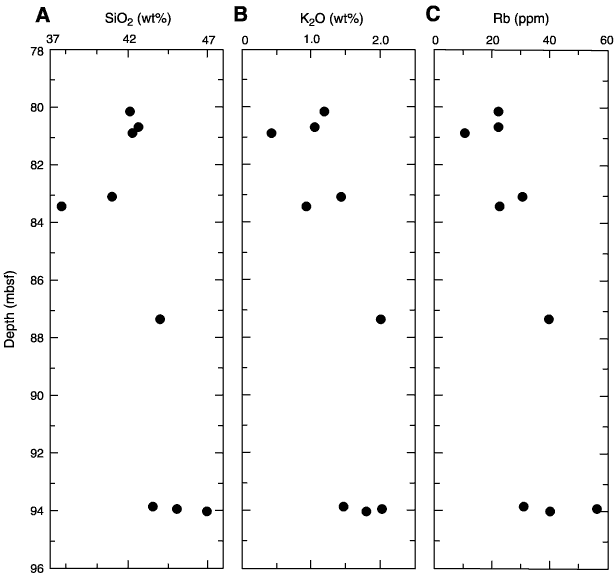
Figure F25. (A) SiO2, (B) K2O, (C) Rb for whole-rock samples from Hole M0008A. Note the systematic increase in values with depth.
Next Section | Table of Contents