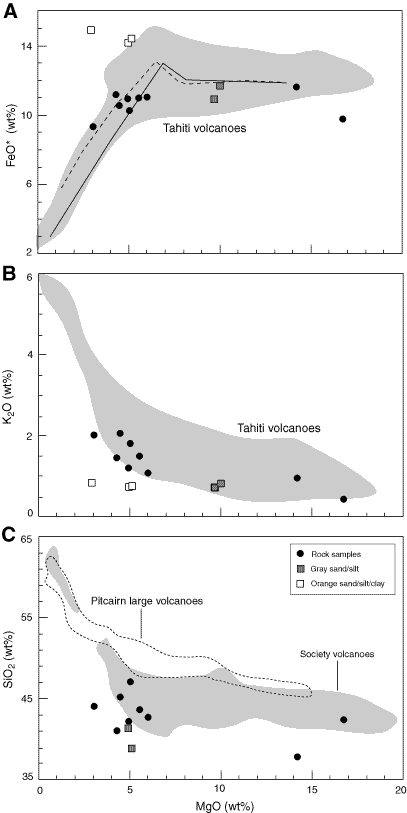
Figure F27. MgO versus (A) total Fe as FeO*, (B) K2O, and (C) SiO2 for whole-rock and volcanic sand/silt samples from Hole M0008A. Almost all the rock and gray volcanic sand/silt samples plot inside the Tahiti volcanic rock field, but the orange volcanic sand/silt samples plot farther away from the field, or in the case of C, out of the diagram. The Society volcano field in C includes samples from Tahiti and other volcanoes that belong to the Society Islands volcanic chain. Dark solid and light dashed lines in A represent model fractionation lines showing the change in magma composition with ~80% crystallization of a parent magma at two different oxygen fugacities using the model of Nielsen (1990). The dark solid line is for higher oxygen fugacity. Background data and figures are from Duncan et al. (1994) and Devey et al. (2003)