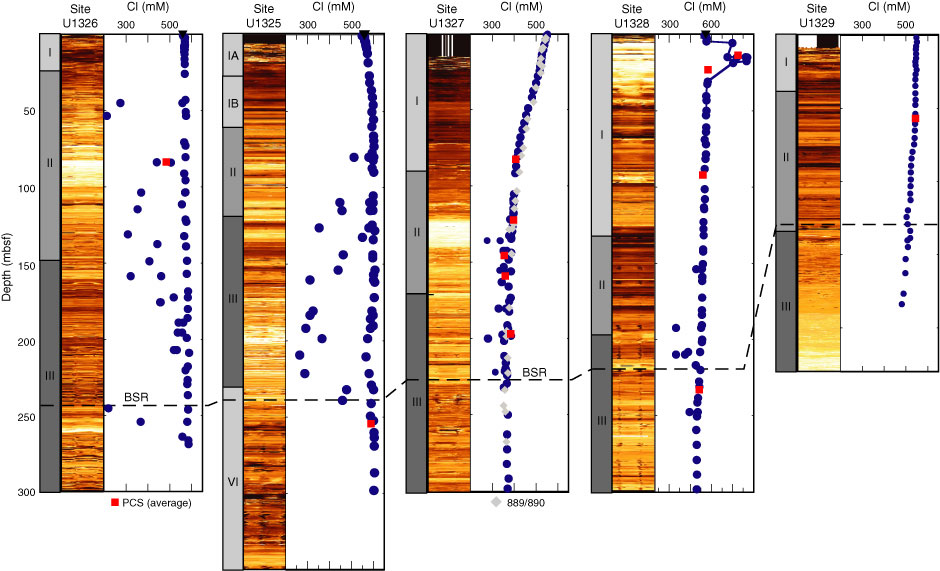
Figure F27. Summary of Expedition 311 interstitial water chlorinity profiles, including average interstitial water Cl from pressure core sampler (PCS) core. Sites 889/890 data are shown for comparison. Also shown are lithostratigraphic units, LWD RAB resistivity images, and location of the bottom-simulating reflector (BSR).