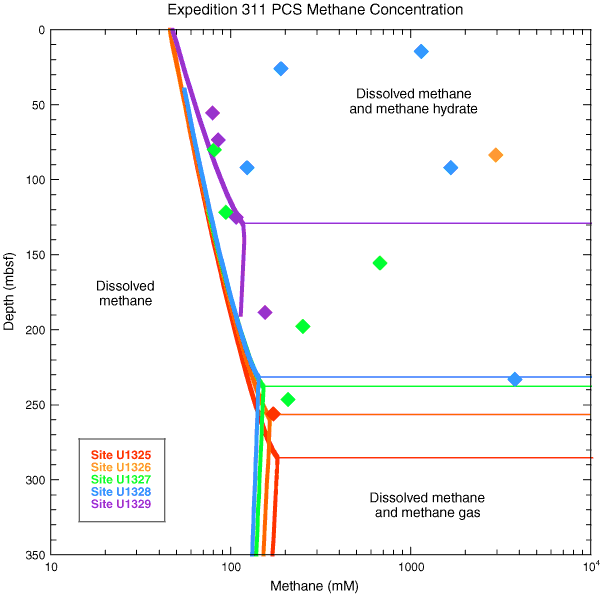
Figure F31. Methane phase diagram for Expedition 311 sites, with total methane concentration measured from depressurized PCS cores. The seafloor temperatures and the salinity profiles were measured, and methane saturation was calculated according to Xu (Xu, 2002, 2004).