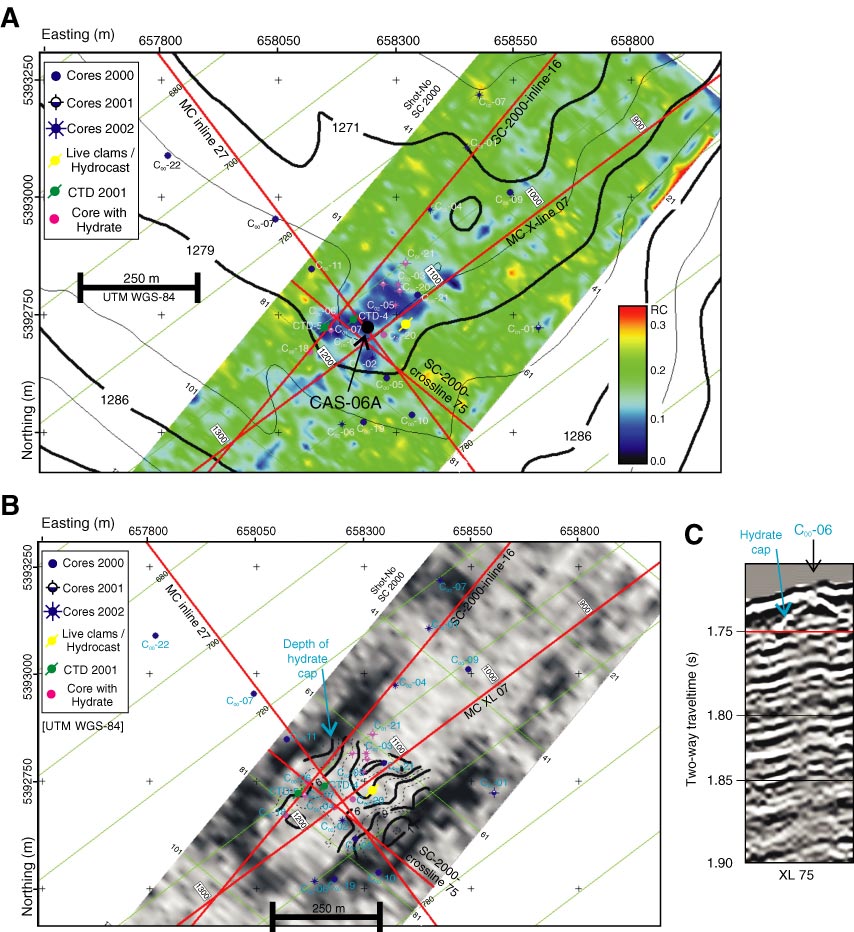
Figure F18. Site survey data for proposed Site CAS-06A. A. Map showing seafloor reflection coefficient from 2000 SCS data with location of piston cores near CAS06A. B. Map showing time slice of instantaneous amplitude from 2000 SCS 3-D data and depth of massive gas hydrate cap reflector. C. Crossline 75 through 2000 SCS 3-D data cube showing gas hydrate cap reflector. Open circles are location of piston cores taken in 2000.