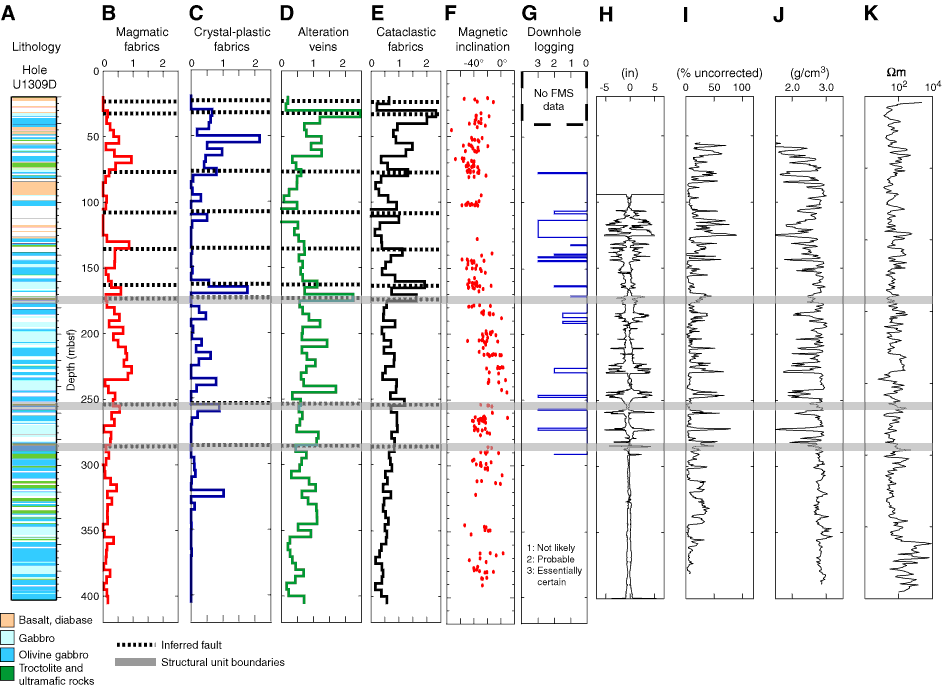
Figure F16. Summary of deformation structures observed on cores from Hole U1309D and in comparison to paleomagnetic data and downhole logging measurements. A. Lithologic column. B. Intensity of magmatic fabric (3 = strong shape preferred orientation). C. Intensity of crystal-plastic fabric (4–5 = mylonitic-ultramylonitc). D. Frequency of alteration veins (5 = >20/cm). E. Intensity of cataclastic fabric (5 = cataclasite). F. Magnetic inclination deduced from core samples that have been demagnetized to remove drilling overprint. Downhole logging results: G. Estimate of likelihood that an interval is a fault zone, based on interpretation of Formation Micro Scanner resistivity images. H. Caliper data show deviation of borehole diameter from 10 inch reference (0 in plot corresponds to a perfectly gauge hole). I. Neutron porosity measurement illustrates relative changes in wall rock porosity. Absolute value is not meaningful here because calibration is for limestone. J. Downhole density variation. K. Resistivity measured by the Dual Laterolog on the Triple Combo tool.