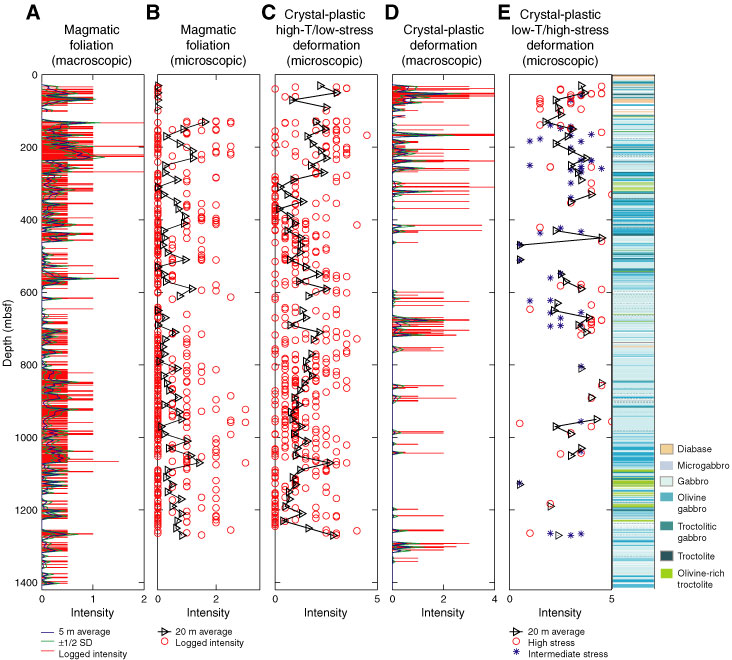
Figure F162. Downhole plots showing the variation of (A) macroscopic magmatic foliation; (B) microscopic magmatic foliation; (C) microscopic crystal-plastic deformation, high temperature (T)/low stress; (D) macroscopic crystal-plastic deformation; and (E) microscopic crystal-plastic deformation intensity estimated both from core and thin section observations (Hole U1309D). SD = standard deviation.
Previous | Close | Next | Top of page