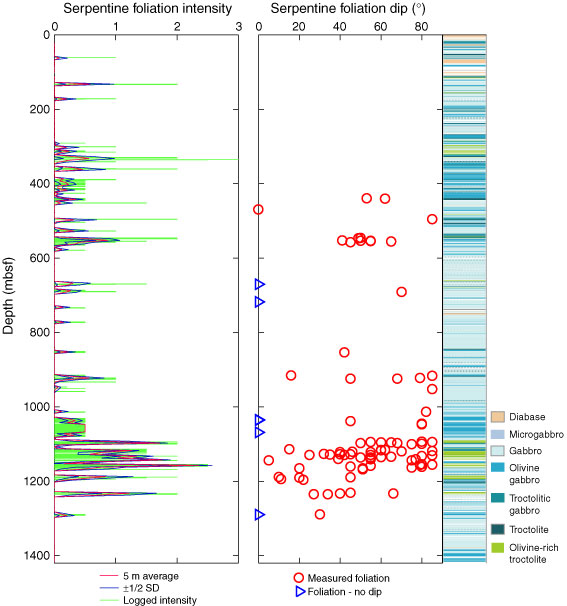
Figure F199. A. Variation of serpentine foliation intensity. B. Dip of serpentine foliation. 5 m average is indicated by the thick blue line. Thin green lines correspond to the mean half standard deviation (SD) for each 5 m interval. The column on the right corresponds to lithostratigraphy in Hole U1309D. Triangles indicate the presence of serpentinite foliation for which no measurement was possible.
Previous | Close | Next | Top of page