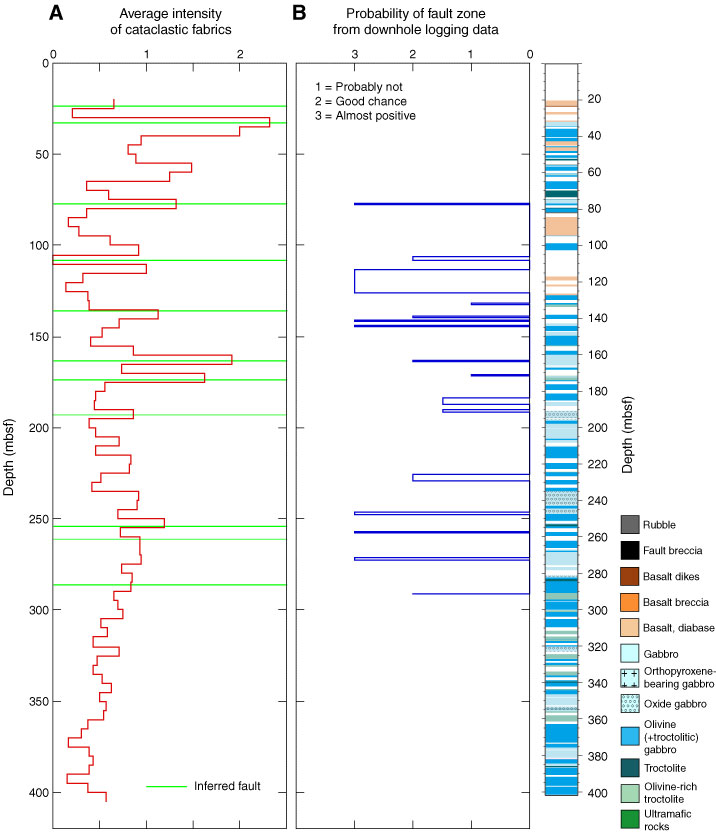
Figure F202. A. Cataclastic fabric intensity averaged over 5 m intervals. Green lines indicate faults inferred on the basis of structural observations of the core. B. Fault zones inferred from borehole resistivity and porosity data. Confidence in fault identification is shown on the horizontal axis.
Previous | Close | Next | Top of page