Previous | Close | Next
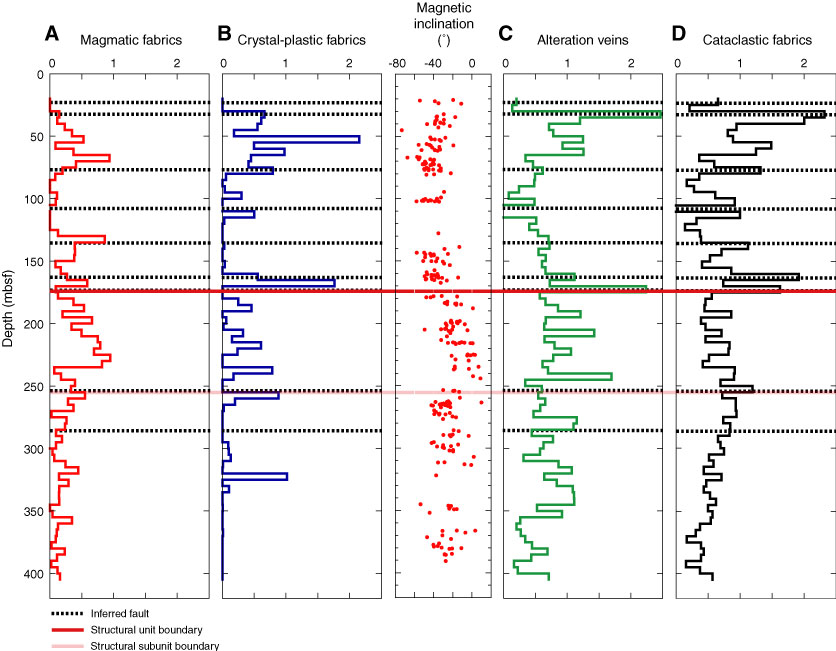
Figure F210. Same as Figure F209, with the addition of paleomagnetic inclination data measured on half cores.
Previous | Close | Next | Top of page