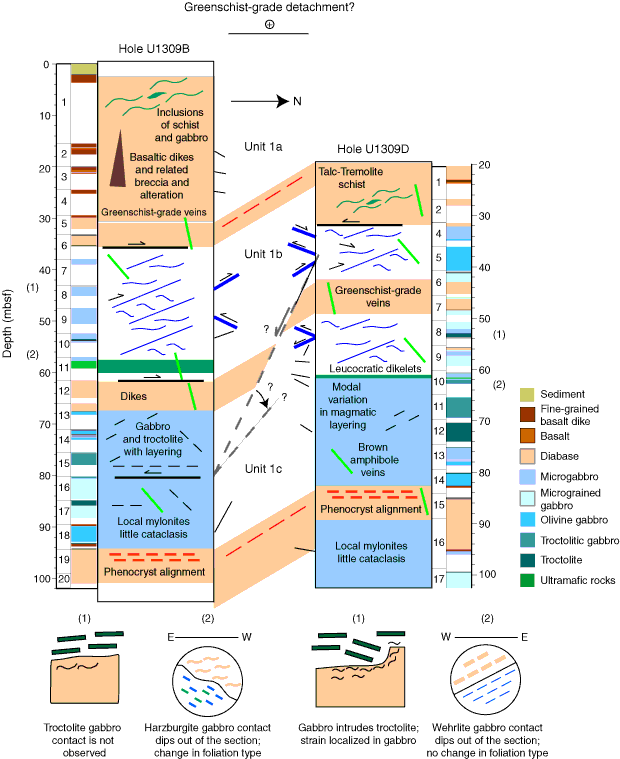
Figure F212. Structures recovered from Hole U1309B and the upper part of Hole U1309D and possible correlations. The tick marks on the inside margins of the lithology columns are qualitative projections of representative measurements onto the north-south section; red = phenocryst alignment, blue = crystal-plastic structures, black = brittle structures. Distribution of veins is shown schematically within the lithologic column, as are the other structures. The trace of the fault from Core 304-U1309B-16R and the dips of diabase units are inferred from the logging data and lithologic correlations, although there are other possible interpretations (indicated by dashed lines and question marks). The structural units are designated based upon changes in deformation intensity, and some faults are inferred at the unit boundaries. Specific observations relating to the ultramafic rocks and gabbro/troctolite contacts are schematic and keyed to the lithology columns.

Previous | Close | Next | Top of page