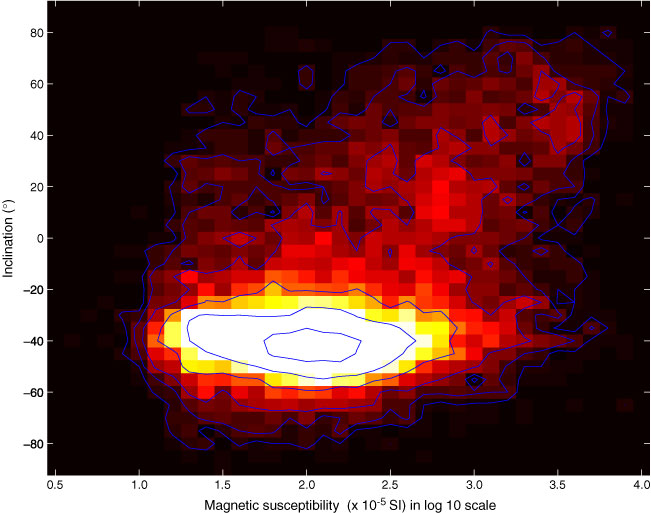
Figure F253. Inclination after 30 mT AF demagnetization and magnetic susceptibility (Expedition 305), showing that concentrations of samples with negative inclinations correlate with intervals of low magnetic susceptibility. Contours = 5, 10, 20, 50, 100, 200 (brightest).
Previous | Close | Next | Top of page