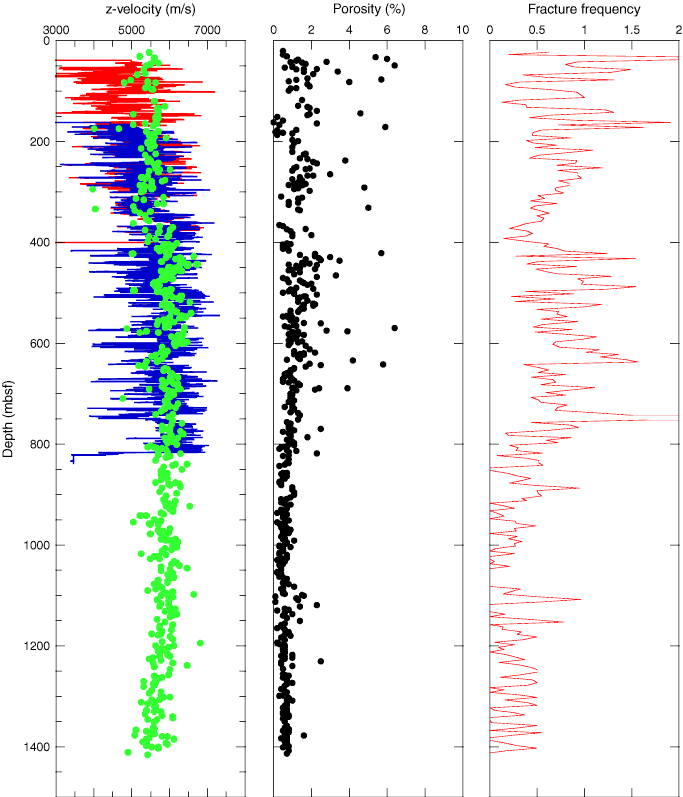
Figure F265. Comparison between logging seismic data (red and blue lines), PWS z-direction velocities (green dots), moisture and density–determined porosities, and fracture frequency for Hole U1309D. Red velocity line = Expedition 304 logging data, blue velocity line = Expedition 305 logging data, red porosity dots = Expedition 304, blue porosity dots = Expedition 305. For fracture frequency, see “Structural geology.”

Previous | Close | Next | Top of page