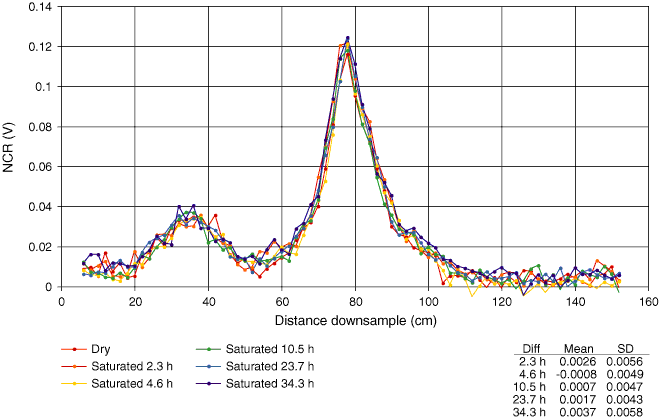
Figure F277. Voltage output from the noncontact resistivity (NCR) sensor on the multisensor track measured on olivine-bearing gabbro (Section 304-U1309D-57R-1 [Pieces 6 and 7]) following different degrees of saturation in seawater. Higher values of the NCR voltage represent more conductive values. The sample measurements extend from 5 to 105 cm; values beyond 110 cm were measured on empty core liner and give a measure of instrumental uncertainty. Diff = difference, SD = standard deviation.

Previous | Close | Next | Top of page