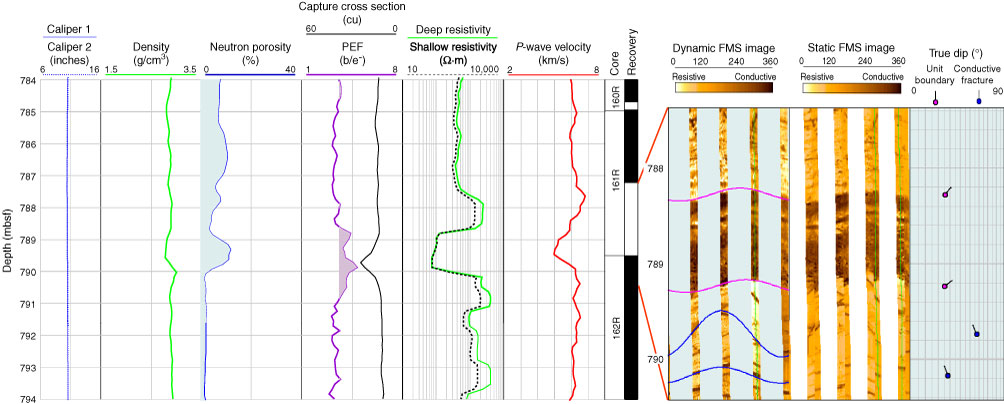
Figure F298. The interval between 788.7 and 790 mbsf shows elevated neutron porosity and photoelectric factor (PEFL) and reduced resistivity and velocity values. In the Formation MicroScanner (FMS) image, it is seen as a low-resistivity layer with a dip of 25° to the northeast, which is probably related to missing rock in Core 305-U1309D-161R.
Previous | Close | Next | Top of page