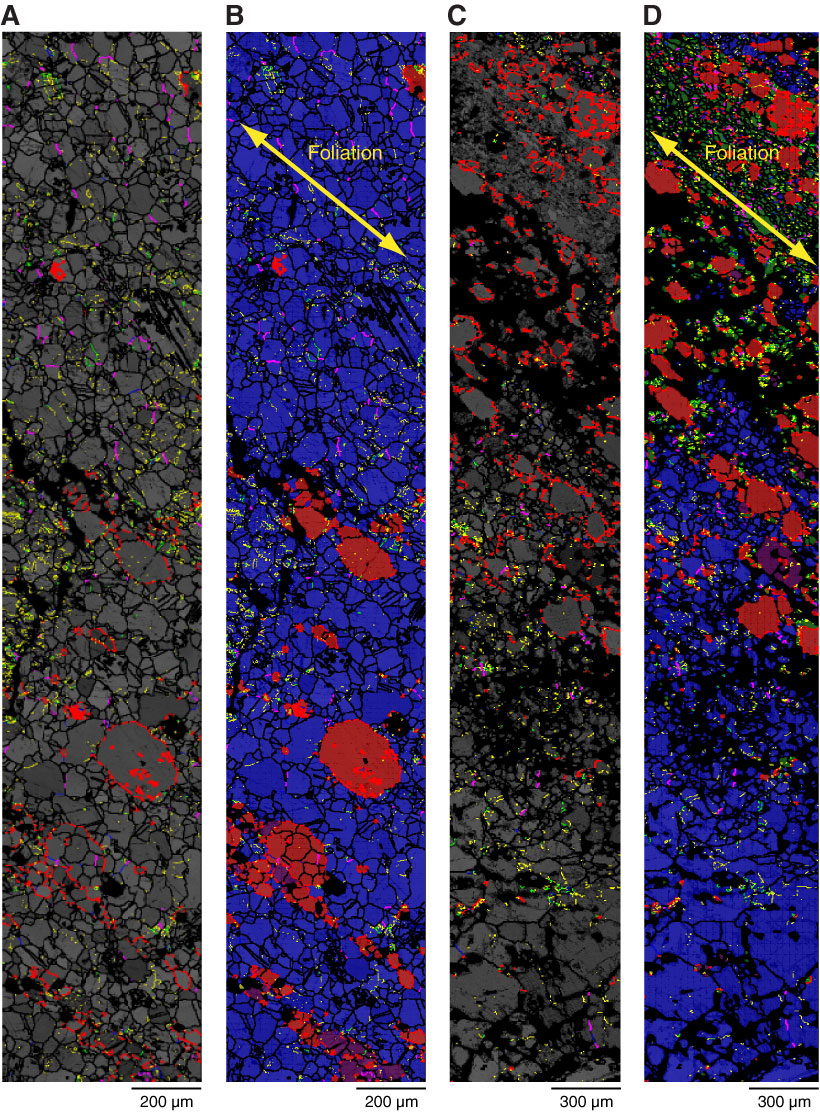
Figure F3. A, C. Band contrast (pattern quality) map for Samples 304-U1309D-64R-2, 43 cm, and 64R-2, 46 cm, with subgrain and grain boundaries marked (boundaries colored by misorientation angle between the two grains). Yellow ≥ 2°, lime green ≥ 5°, blue ≥ 10°, pink ≥ 20°, and black ≥ 30°. Boundaries between phases are marked in red. B, D. Phase map showing each mapped phase in a different color for Samples 304-U1309D-64R-2, 43 cm, and 64R-2, 46 cm, with grain boundaries marked. Blue = plagioclase, red = diopside, purple = enstatite, green = hornblende, yellow = ilmenite.
Previous | Close | Next | Top of page