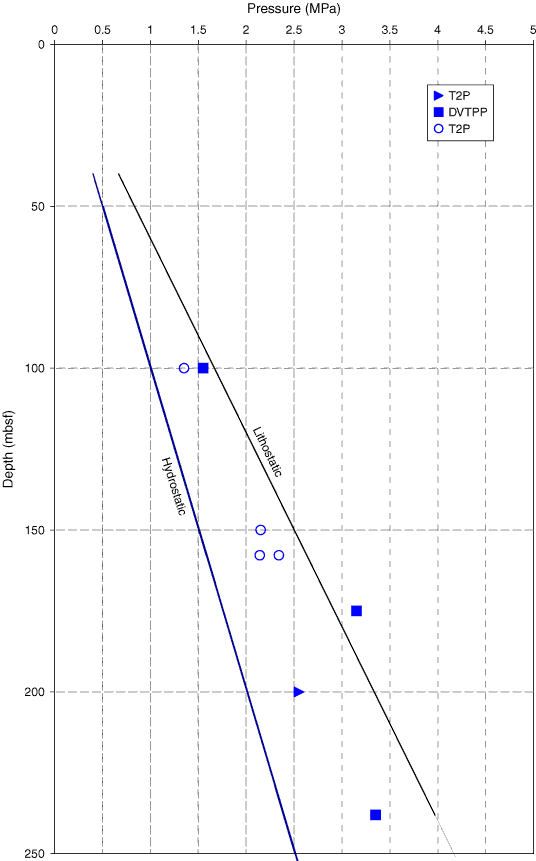
Figure F65. Maximum in situ pressures estimated from the last measurement on pressure dissipation curves from the temperature/dual pressure (T2P) probe and Davis-Villinger Temperature-Pressure Probe (DVTPP). Pressures interpreted from pressure rebound curves are also shown (open circles). Hydrostatic pressure is calculated for an assumed water density of 1.024 g/m3. Lithostatic stress is calculated for an assumed bulk density of 1.7 g/m3. All pressure data are referenced to the seafloor.

Previous | Close | Top of page