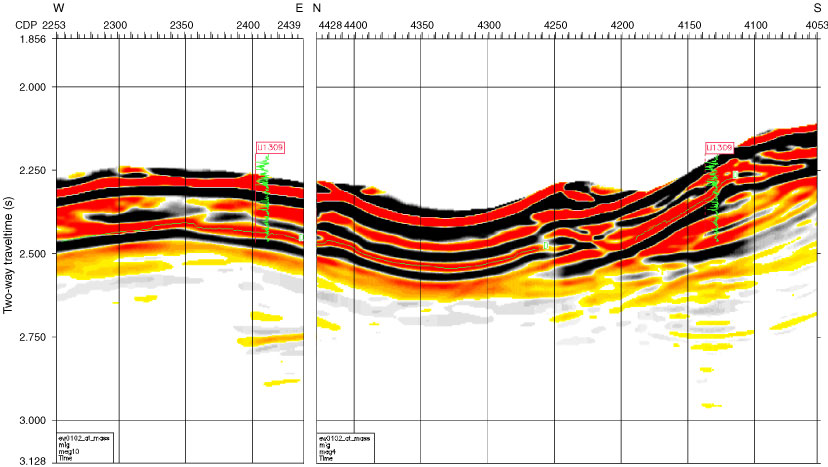
Figure F302. Composite seismic display of migrated MCS lines Meg-10 (left) and Meg-4 (right) (map view of lines is shown in Figure F2). The projection of Hole U1309D onto each line is shown. The green curve displayed represents the logging density. CDP = common depth point.
Previous | Close | Next | Top of page