![]() Figures F1-F9
Figures F1-F9
![]() Table
T1
Table
T1
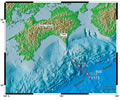
F1. Map of Leg 190 and 196 sites.
F2. Depth section of sites and structural features.

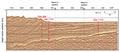
F3. Seismic time section across Sites 1173 and 808.
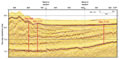
F4. Seismic depth section across Sites 1173, 1174, and 808.
F5. Composite seismic section through Leg 196 drill sites.
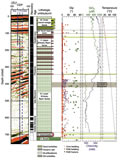
F6. Site 1173 seismic, lithologic, and logging summary.
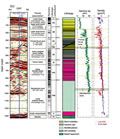
F7. Site 808 seismic, lithologic, and logging summary.
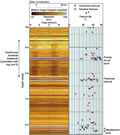
F8. RAB image showing interpreted fractures.
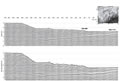
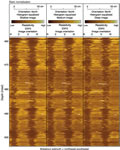
F9. Breakouts from shallow, medium, and deep RAB images.
T1. Operations summary.