FMS plots | |
 |
|
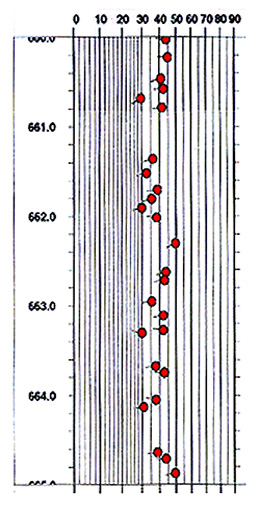
Turbidite sequences are imaged here by the FMS data. Red sine waves on the images trace bedding planes.The corresponding "tadpole" plot shows the average dip is roughly 40 degrees to the west. Interpretive work of the FMS data can be performed either on the ship or onshore with the GeoFrame software. |
|